Interactively visualizing timm learning rate schedulers
Are you a PyTorch Image Models (timm) user? Want an easier way to explore learning rate scheduler parameters? I've created a lightweight interactive dashboard to help you visualize LR schedules clearly.
Here's an example using SGDR with warm restarts: 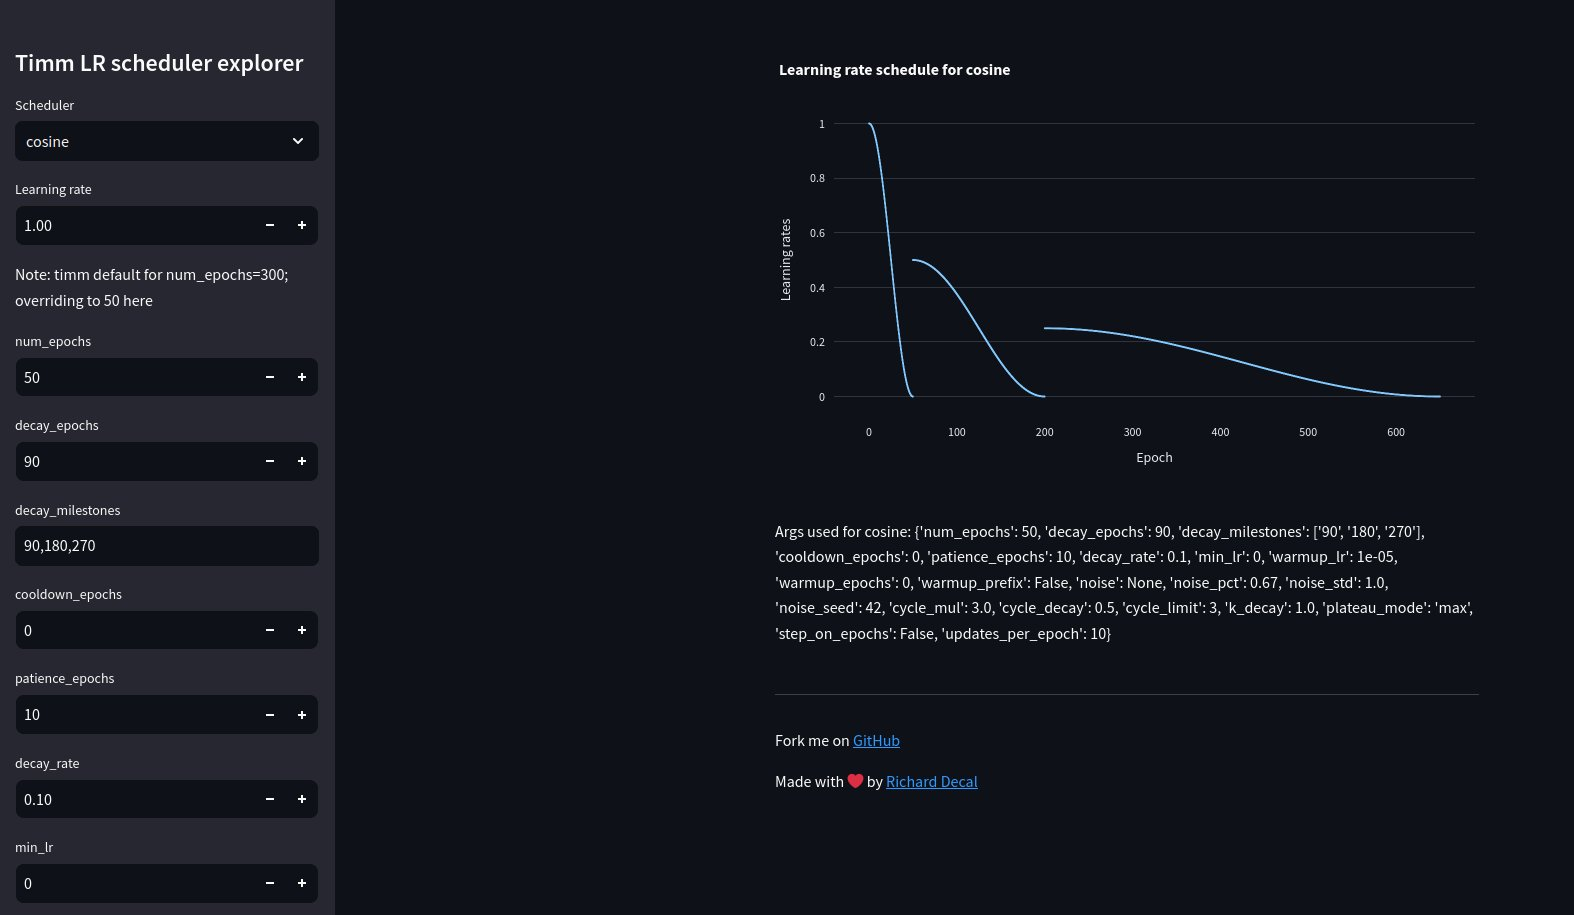
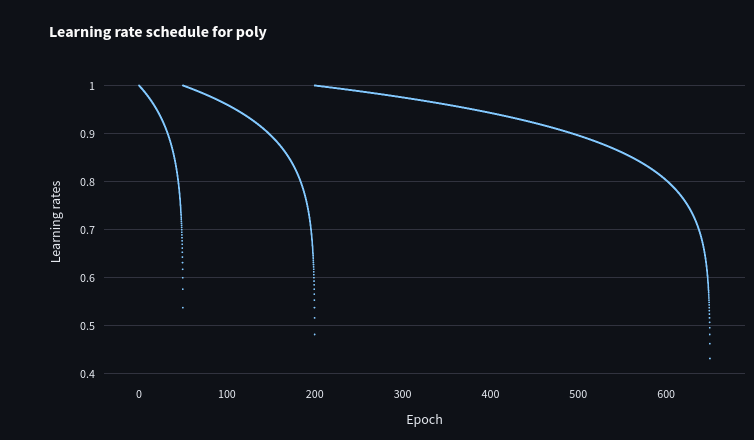
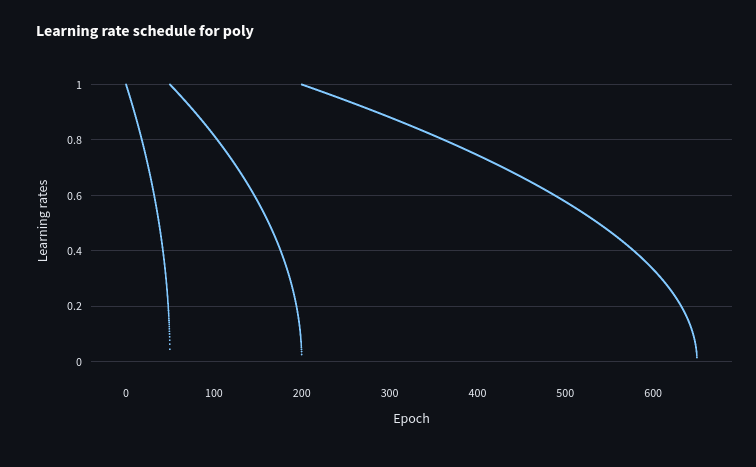
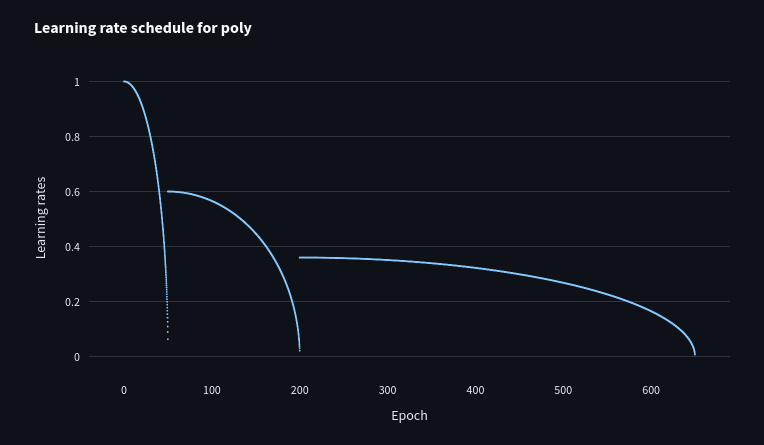
It can be hard to understand how some parameters affect the schedule without visualizing them. For instance, see how decay_rate and k_decay affect the Poly scheduler:
Or the non-obvious ways warm-up can affect an LR schedule:
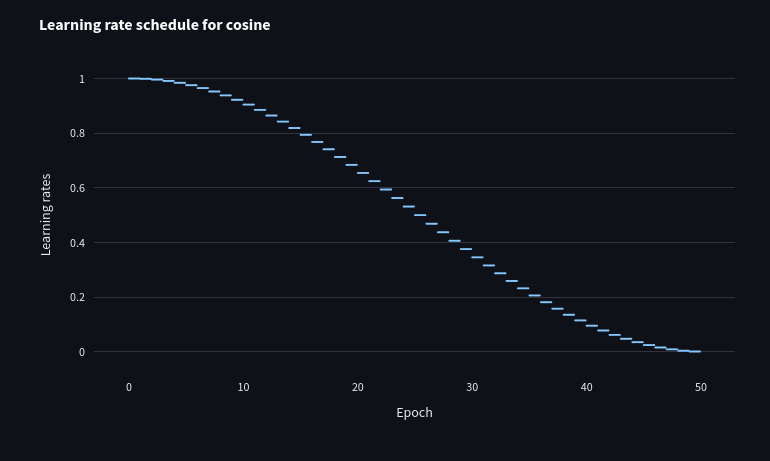
(1) Vanilla cosine scheduler:
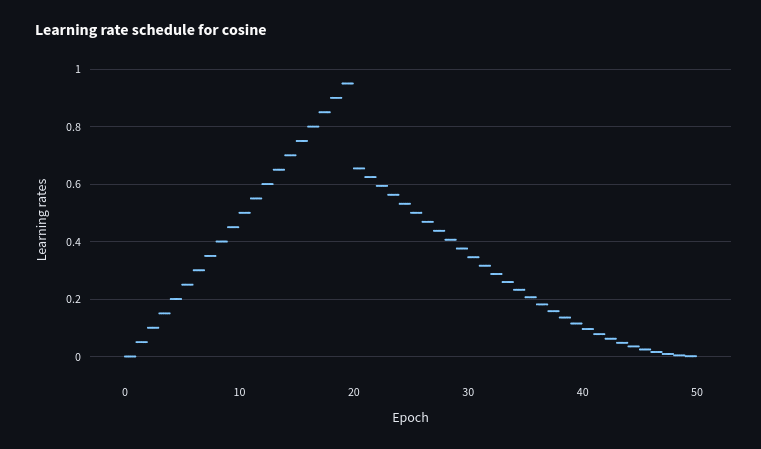
(2) Adding warm-up:
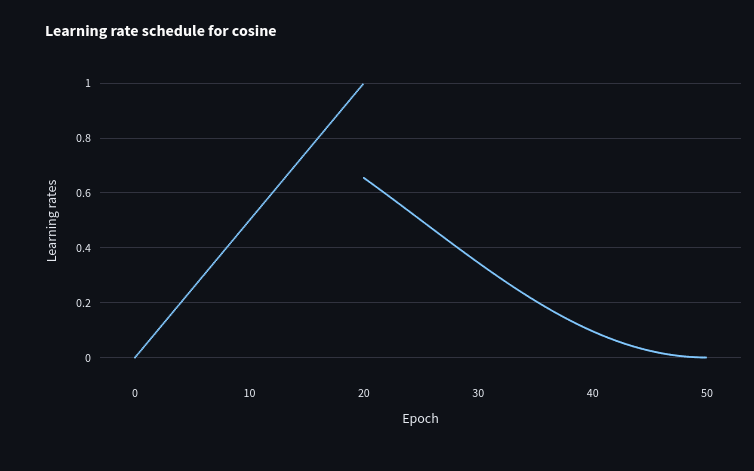
(3) Adding step_on_epochs=False:
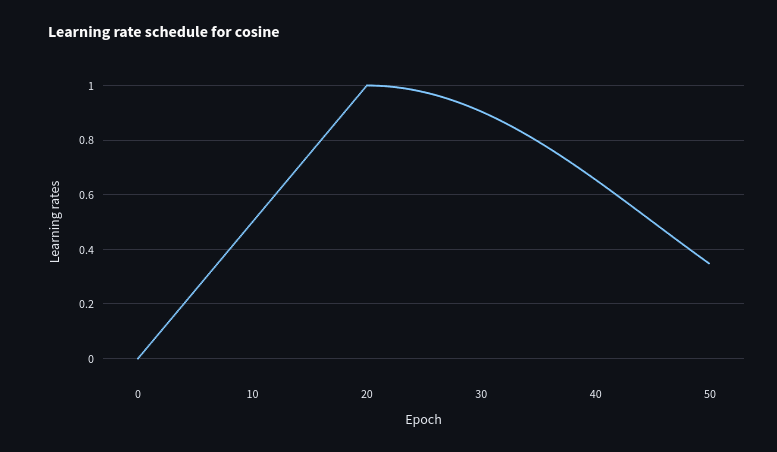
(4) Adding warmup_prefix=True:
Check it out on GitHub. Stars appreciated! timm-lr-scheduler-explorer
Special thanks to PyTorch vision legend Ross Wightman for tirelessly maintaining timm.